
TimeLine Columns
Reference for the standard TimeLine columns and how each column is used by the Gantt chart and calculation engine.
TimeLine stores the schedule in normal table columns. The Gantt chart reads the mapped columns and writes calculated results back where the file supports them.
Main planning columns:
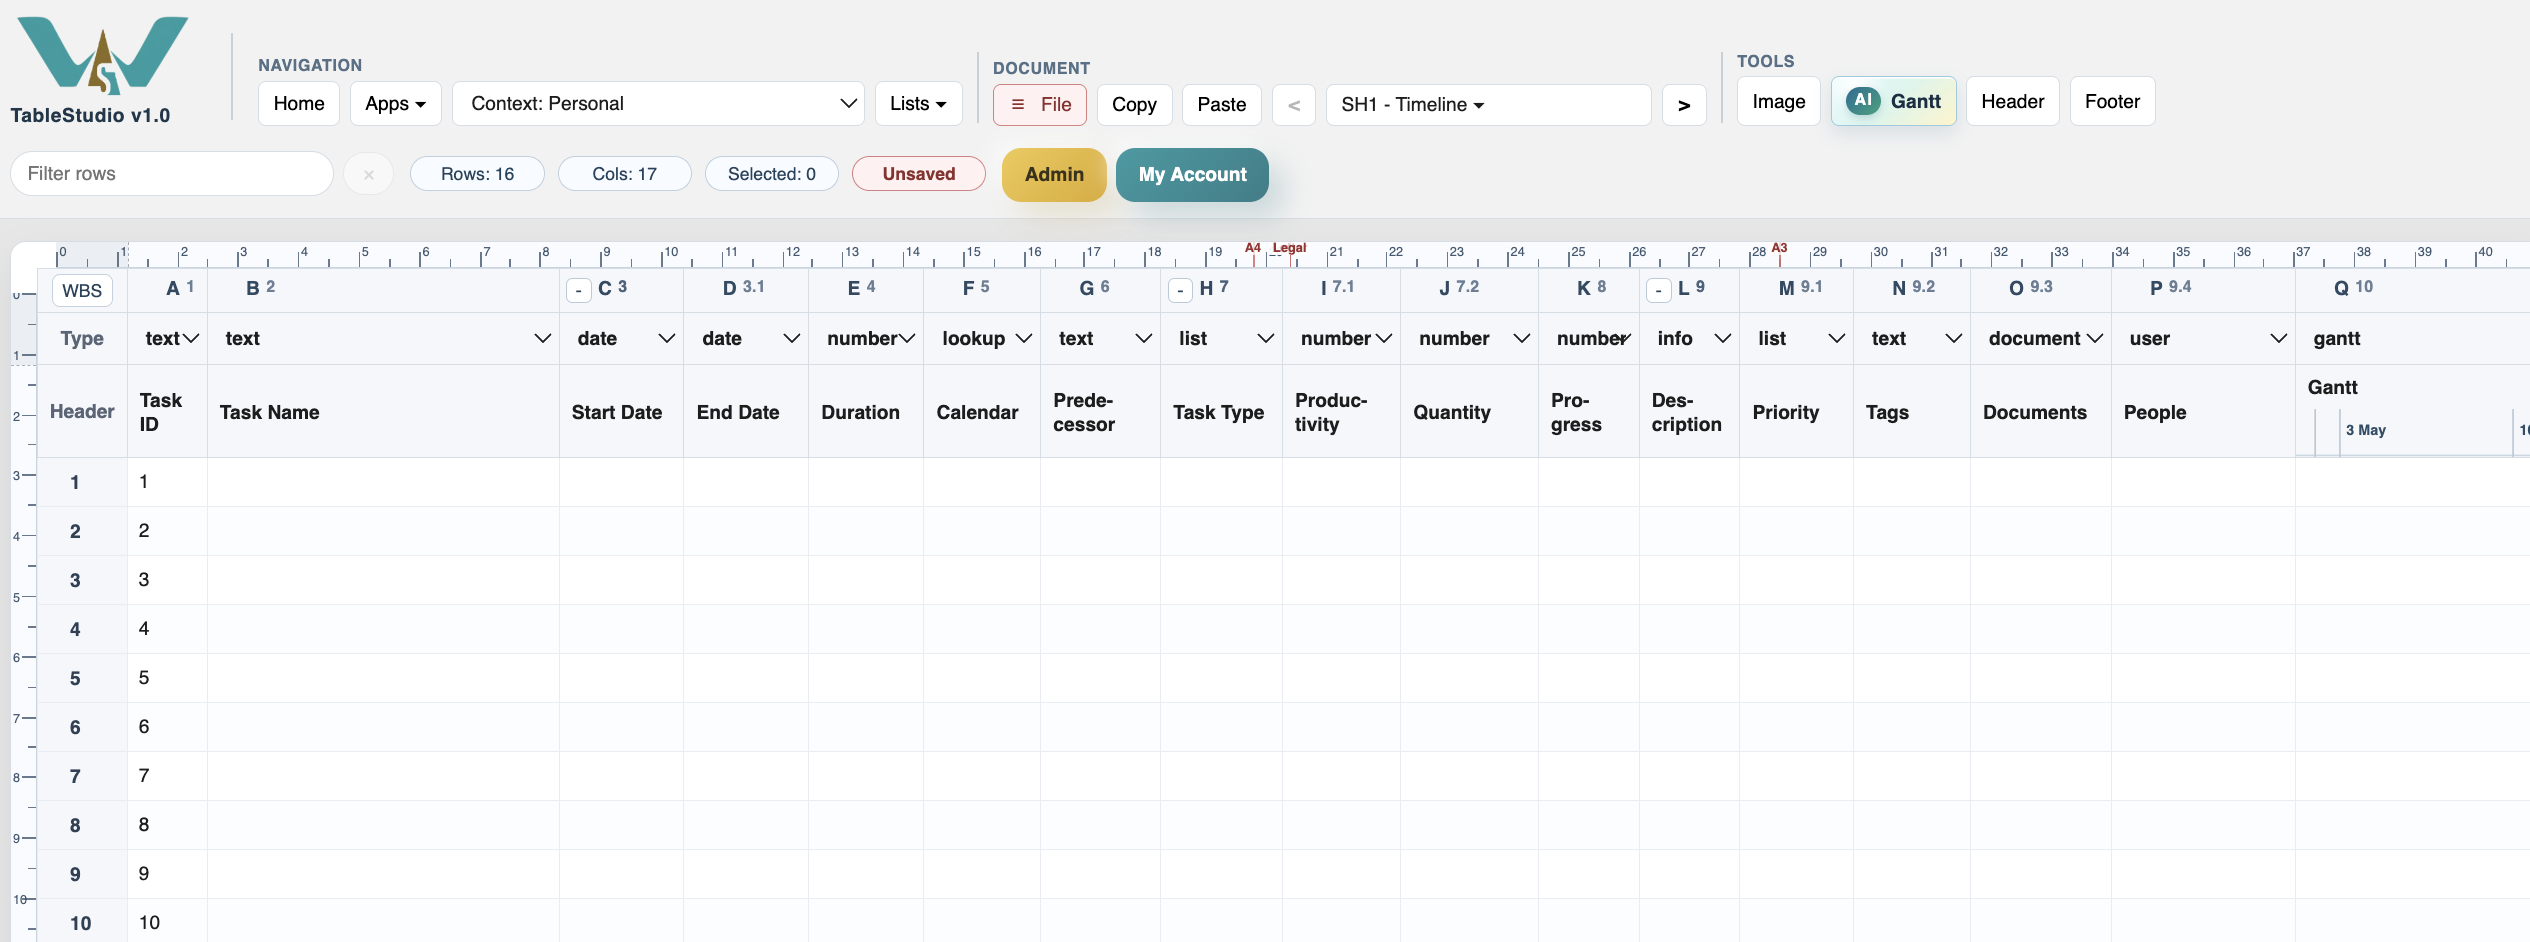
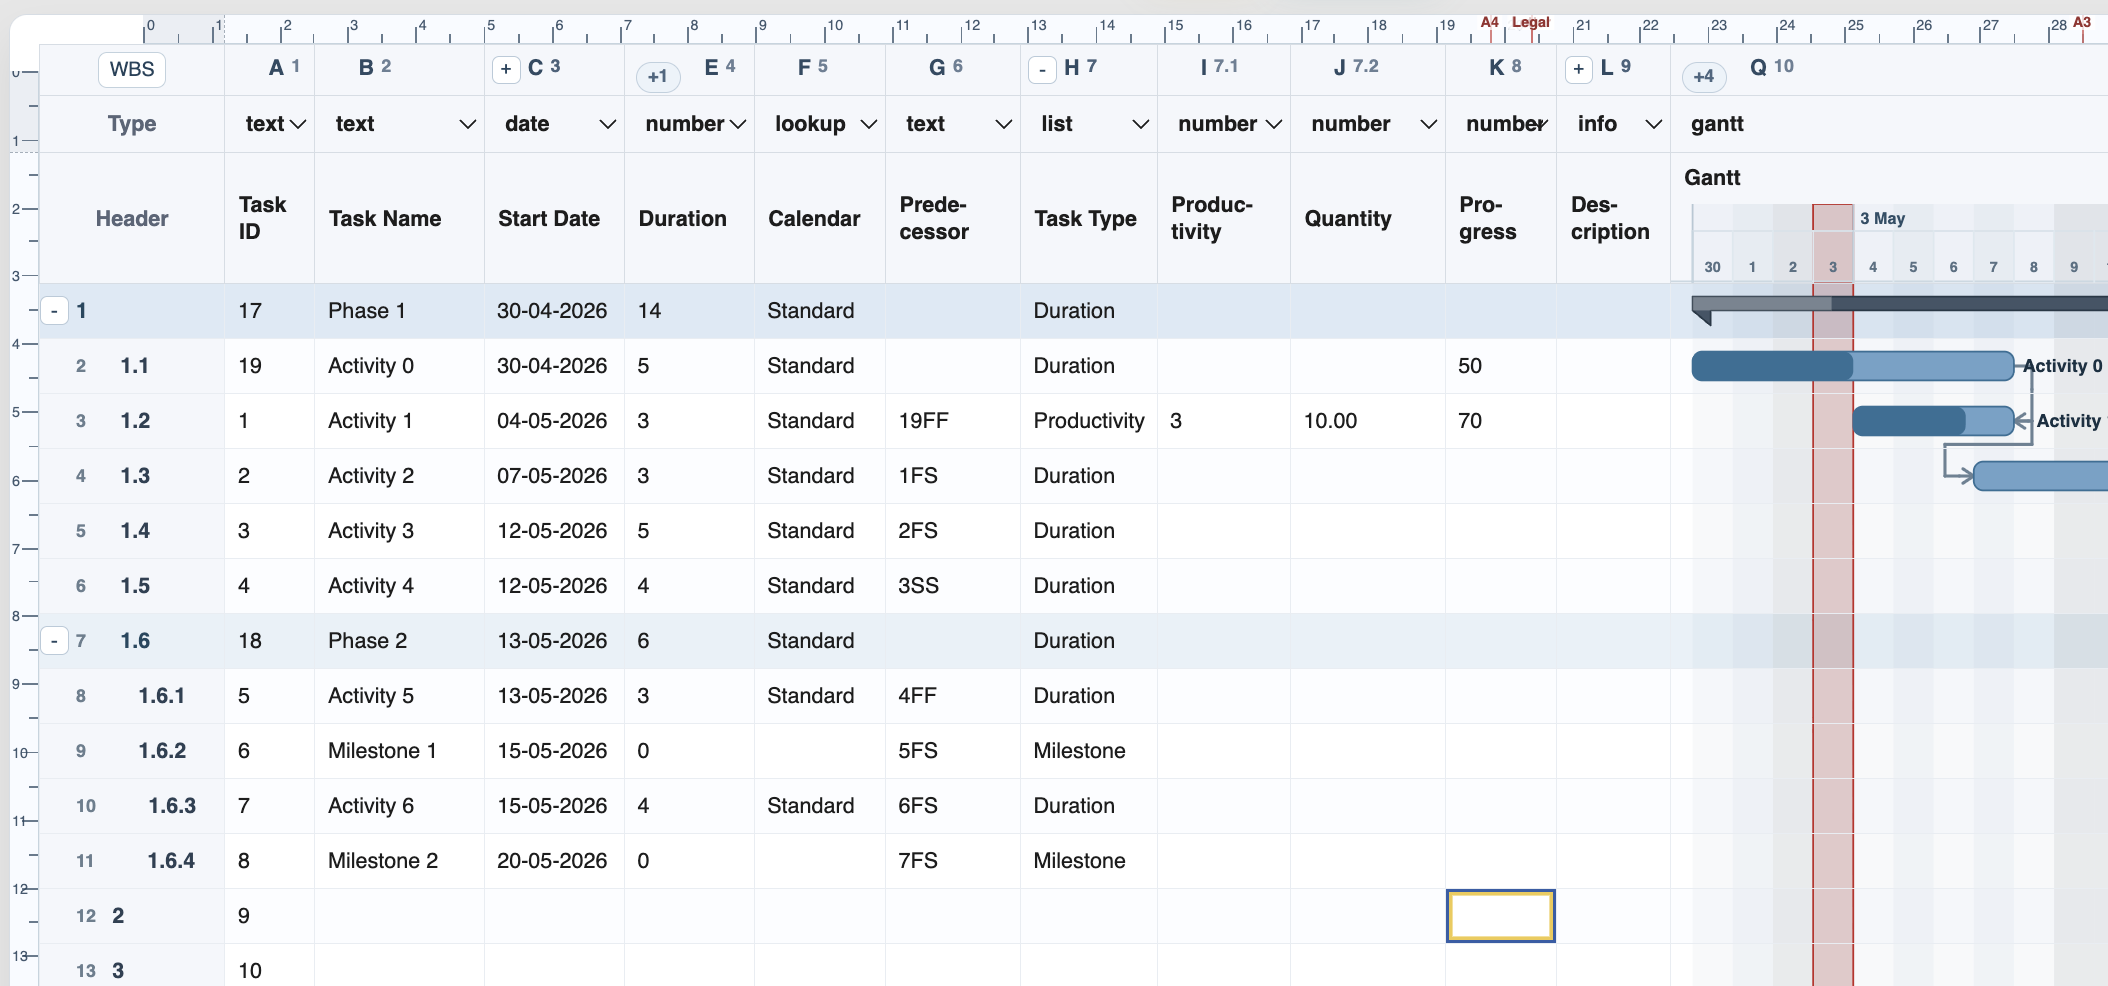
Task IDis the stable task number used by predecessors. When mapped, it mirrors the row ID and is normally read-only.Task Nameis the label shown in the table and, when enabled, beside the activity in the chart.Start Dateis either typed by the user or calculated from predecessors.End Dateis calculated from the start date, duration, task type, calendar, and dependencies.Durationis the working duration for normal duration tasks. It can also be calculated when the task uses productivity mode.Calendarchooses the working calendar used for that task.Predecessorstores dependency expressions such as1FS,1FS+2d, or3SS.Task Typecontrols whether a row is a Duration task, Productivity task, or Milestone.Progressstores completion percentage and can be shown as progress fill on the activity.
Extended planning columns:
ProductivityandQuantitylet TimeLine calculate duration from production data.Description,Priority,Tags,Documents, andPeoplesupport coordination with other WorkStudio planning surfaces.
Rows can also act as WBS phase or summary rows. In that case, the chart draws a summary activity and derives dates from the child rows under that WBS level.
Related: Create a New TimeLine, Task Types, WBS and Summary Rows, Dependencies and Predecessors.
Visible and grouped columns
The default TimeLine layout keeps the key planning fields visible and groups supporting fields so they can be opened when needed.
Productivity columns
When a task uses Productivity, Quantity and Productivity are used to calculate the working duration.
Enable JavaScript to use reading progress and usefulness ratings.