
Display Options
Explains timeline scale, day labels, day bands, weekend bands, current day display, task labels, and activity shapes.
Display options control how the same schedule is presented on the chart.
Timeline scale can be set manually or left on Auto. In Auto mode, TimeLine tries weeks first, then months, then years when there is not enough space.
Show day labels when space allows displays day numbers when the chart has enough room. If labels would overlap, TimeLine reduces detail to keep the header readable.
Display day bands on chart draws subtle vertical day bands across the chart. Display weekends on chart highlights weekends consistently so both weekend days are visually grouped.
Show current day in red draws a red day marker across the available chart rows when the current day falls inside the visible range. This is off by default so project charts do not look urgent unless the user chooses it.
Activity display settings control bar height, arrow or bar shape, color, border, progress fill, and label placement. If the task label cannot fit beside the task, TimeLine uses available space and truncates where needed.
Related: Gantt Column Settings, Task Types, Milestones.
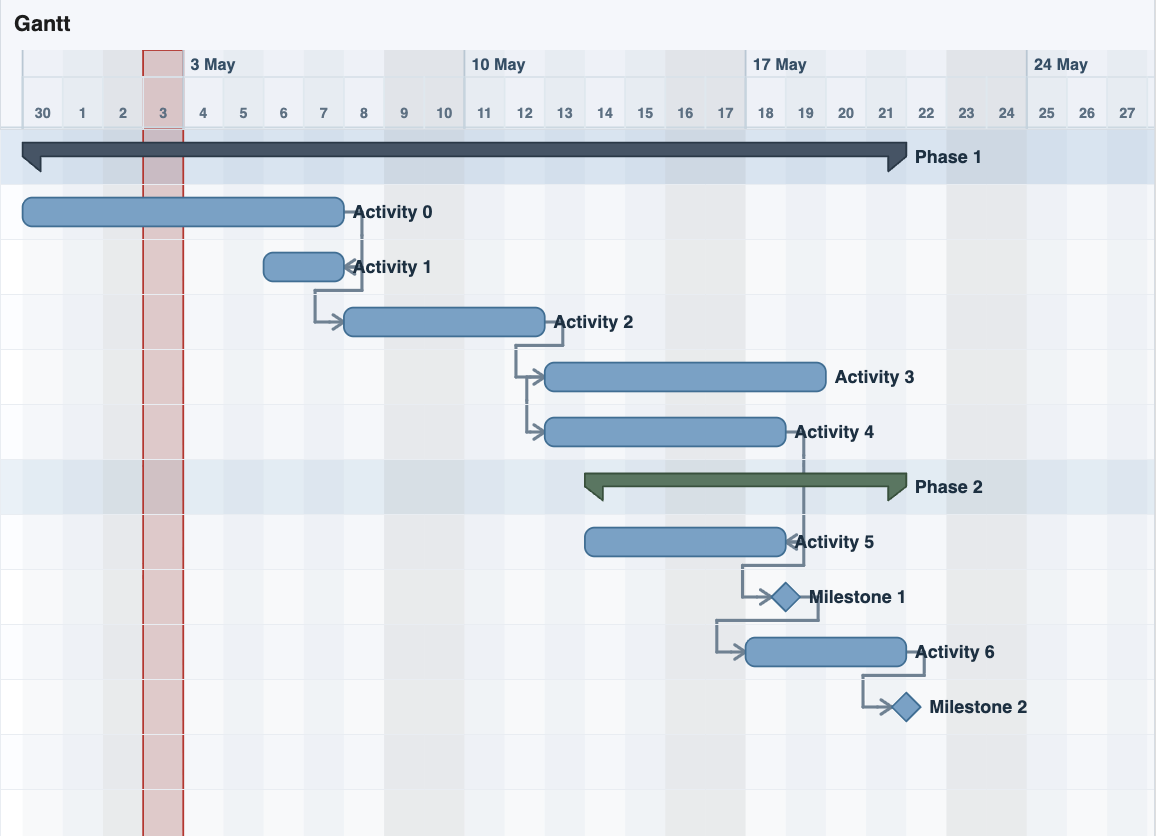
Day bands, weekends, and current day
The chart can show day bands, weekends, and the current day marker together.
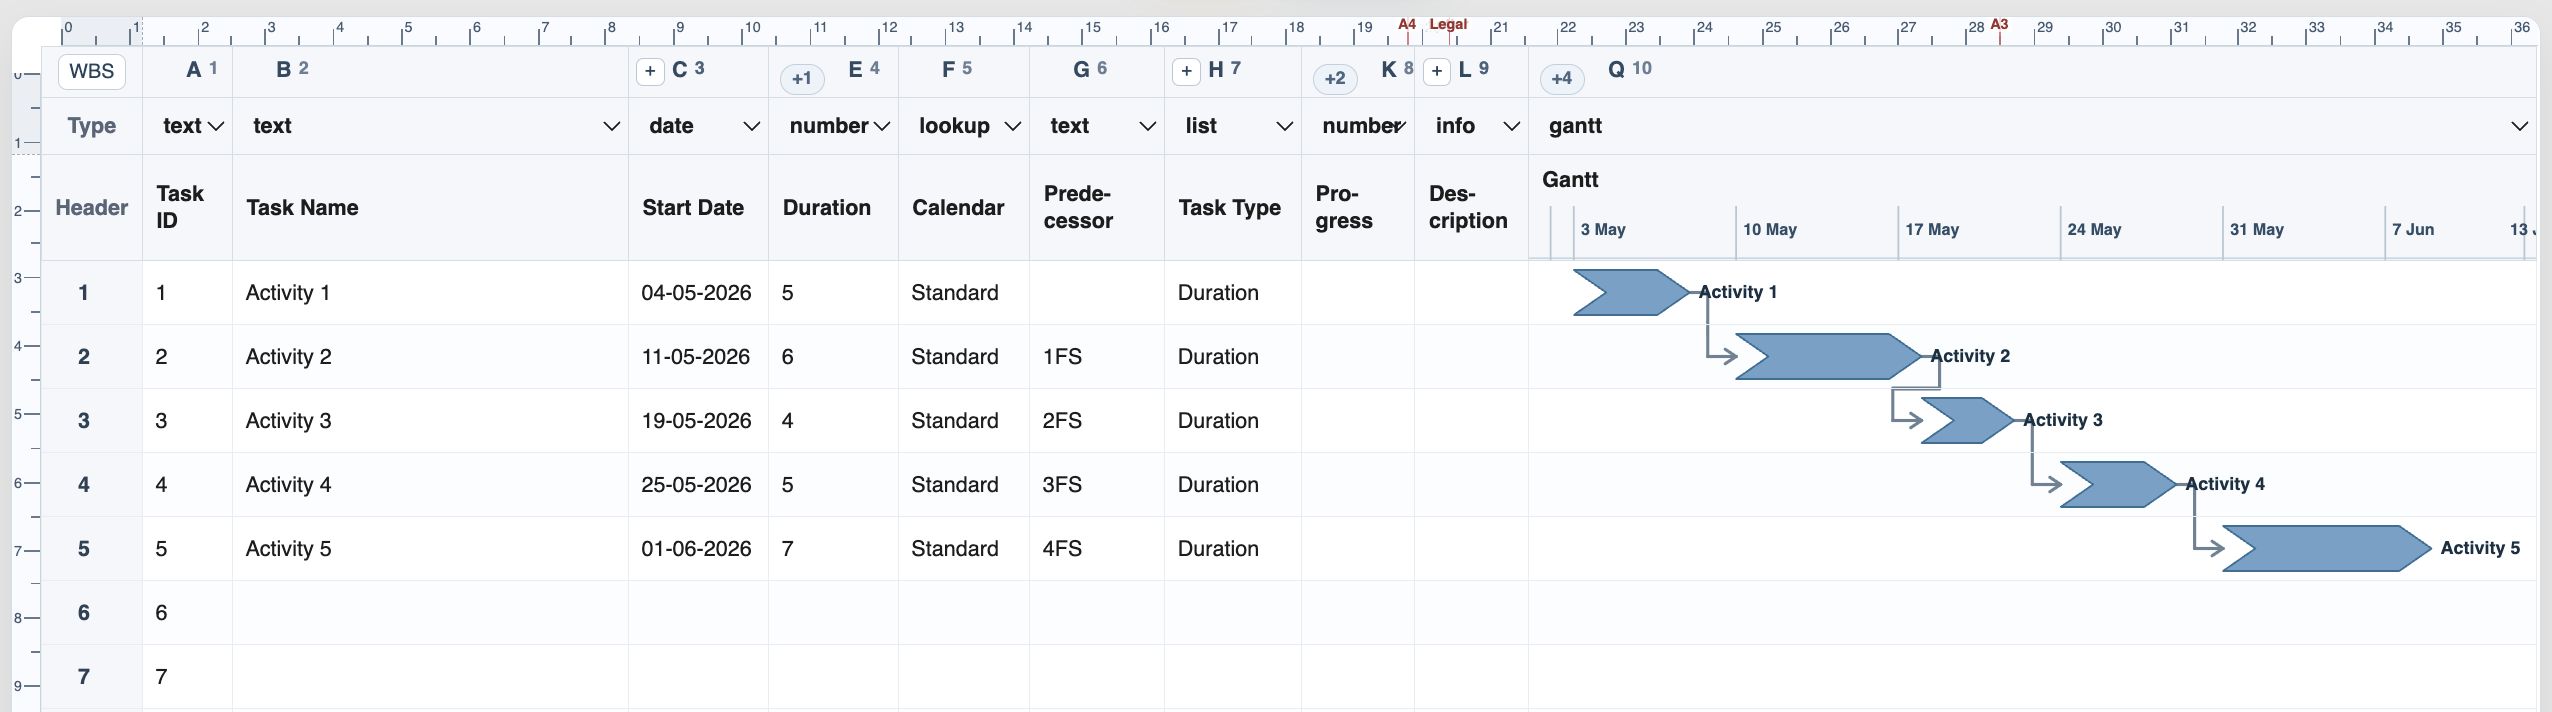
Arrow activity shape
Arrow-shaped activities can be used when the visual language should emphasize forward movement.
Enable JavaScript to use reading progress and usefulness ratings.