
Geotechnical Charts in TableStudio
Create borehole, cross-section, and surface heat-map views from drill and layer tables.
Geotechnical charts turn borehole layer data into visual objects inside a TableStudio sheet.
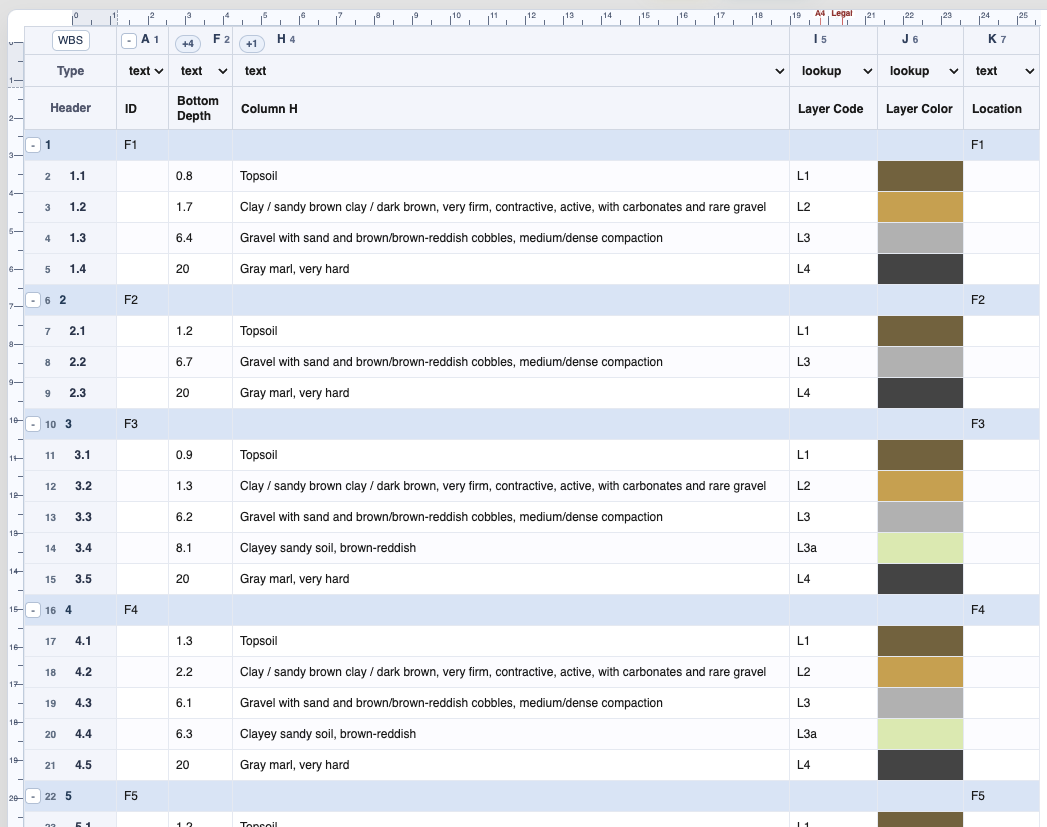
The source table usually contains a section/order field, borehole ID, location or X/Y/Z values, layer top depth, layer bottom depth, layer name, layer code, and optionally layer color.
Layer color can come from a color column or from the fill style of the source cell when lookup styles are enabled.
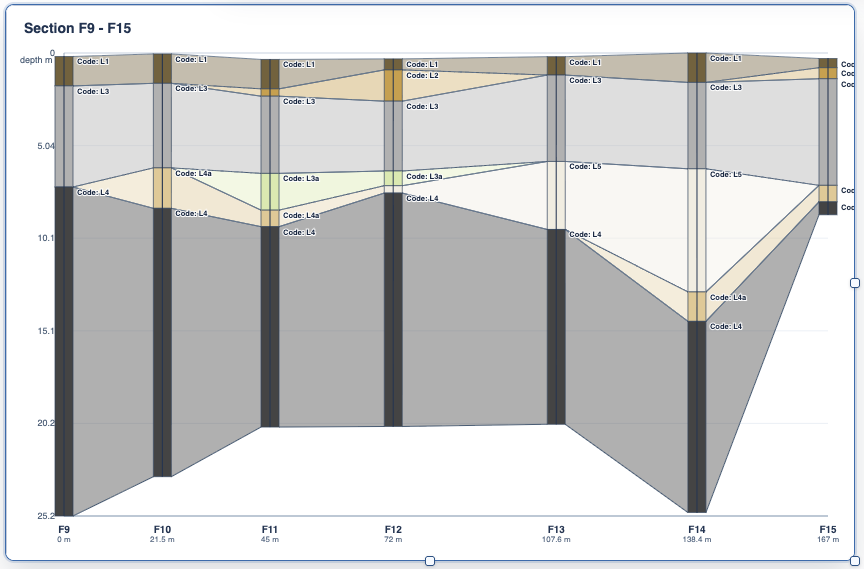
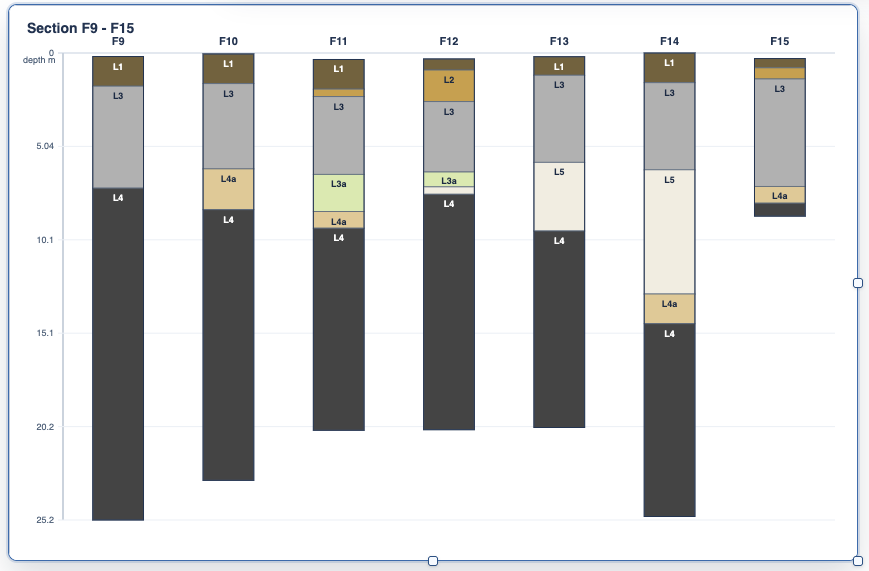
A borehole chart shows one or more boreholes vertically. A cross-section chart connects layers by layer code, not simply by row order. If a layer is missing from one borehole, the layer geometry tapers toward the midpoint between boreholes rather than continuing incorrectly through the missing drill.
A surface chart shows an interpolated heat-map surface for a chosen layer value. Use it when you want to understand how a layer top or depth changes across drill locations.
For cross-sections, choose the section or section order explicitly so the chart follows the intended borehole path.
Use the label options to decide which fields appear directly on the chart and which fields appear in the legend below the chart.
Related: Create a Geotechnical Cross-Section, Charts in TableStudio, Column Type: Lookup.
Source table
A clear source table makes the chart mapping predictable.
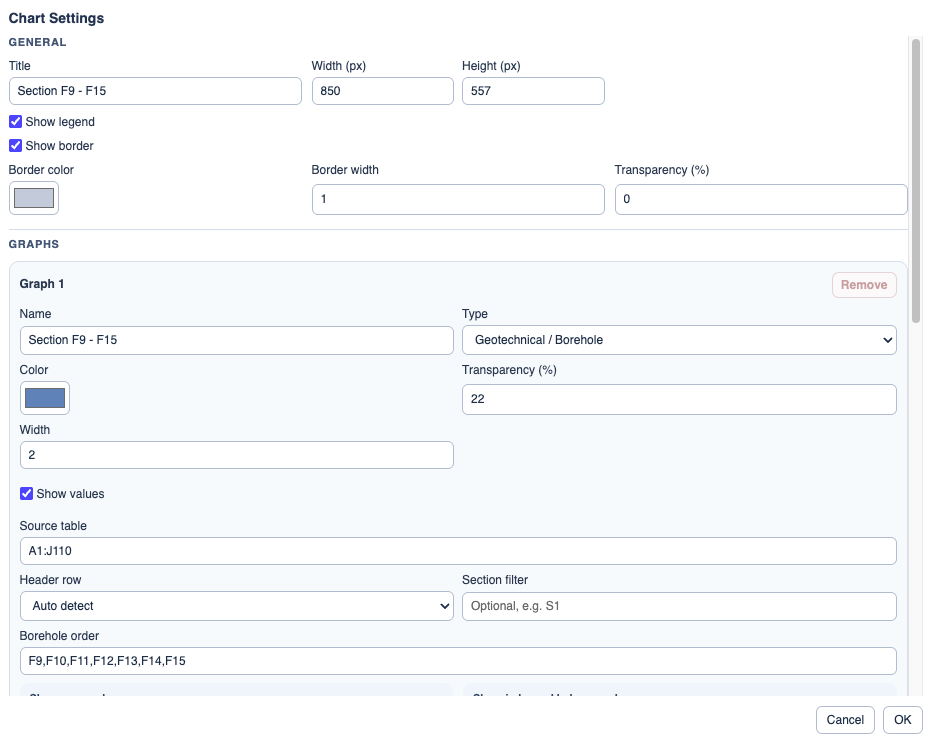
Geotechnical settings
Map the source columns for section, ID, location, depths, layer name, code, and color.
Borehole chart
Borehole charts show each drill vertically.
Cross-section chart
Cross-sections connect same-code layers between drills.
Enable JavaScript to use reading progress and usefulness ratings.