
Charts in TableStudio
Insert movable chart objects, configure one or more series, use ranges as sources, and print or export the chart object.
Use Chart when a table range should become a movable visual object inside the sheet.
A chart object can be selected, moved, resized, printed, and exported from its context menu. The settings window controls title, size, border, legend, transparency, and the graph series.
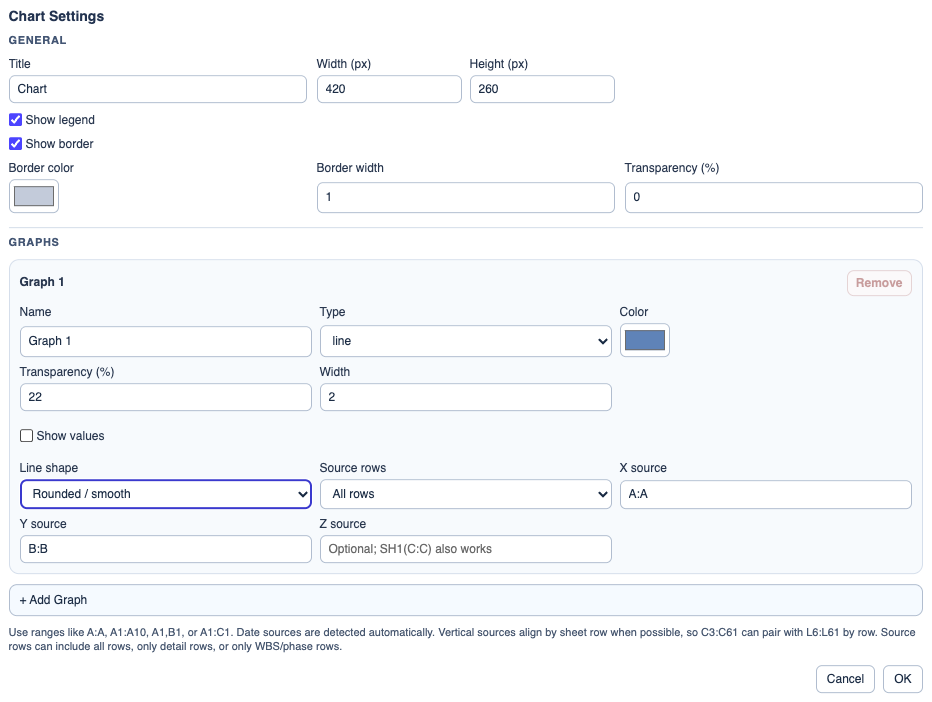
Each graph series has its own source ranges. Sources can be normal ranges such as A1:A10, full columns such as A:A, several separate ranges such as A1,B1,C1, or cross-sheet sources such as SH1(A:A).
Normal chart types include line, bar, pie, and points. Line charts can be rounded, straight, or stepped.
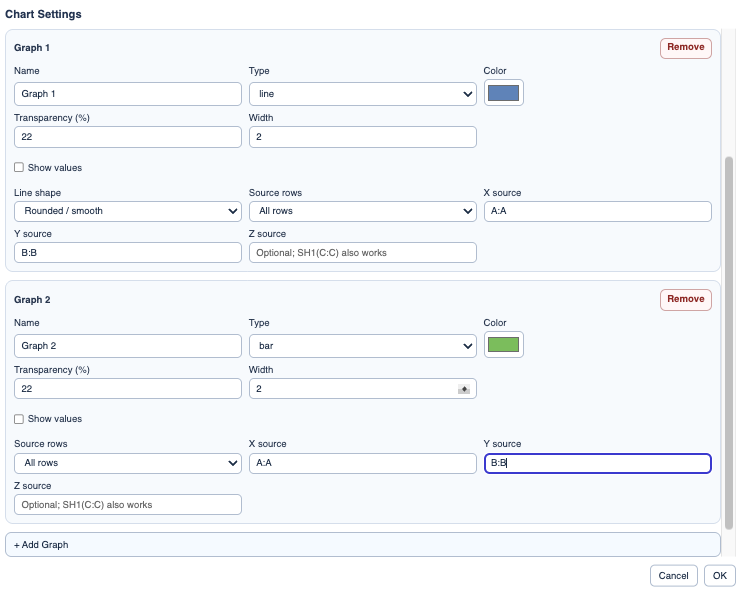
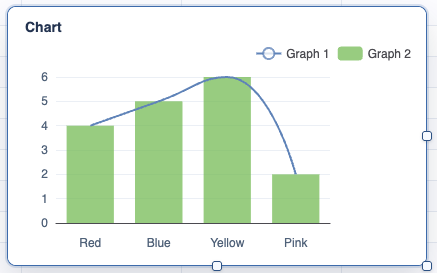
When several graph sections are added, TableStudio draws several graphs in one chart using their own source ranges and style settings.
Use row filtering when a full-column source should include all rows, only normal detail rows, or only WBS/phase rows.
Related: Create a Line Chart in TableStudio, Locations and Map Charts in TableStudio, Geotechnical Charts in TableStudio.
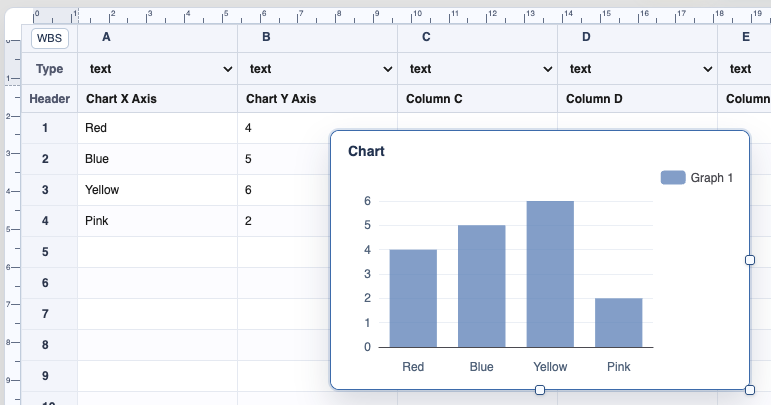
Chart settings
Configure title, size, legend, border, source ranges, chart type, color, and labels.
Two graph sections
Add more graph sections to draw several graphs in one chart.
Line chart result
Line charts can use date values on the X axis and can show values on the graph.
Enable JavaScript to use reading progress and usefulness ratings.