
Create a Line Chart in TableStudio
Insert a chart object, set source ranges, add a second graph, and choose line style and labels.
Use this tutorial when a table range should become a chart object.
Related: Charts in TableStudio.
Insert or select the chart
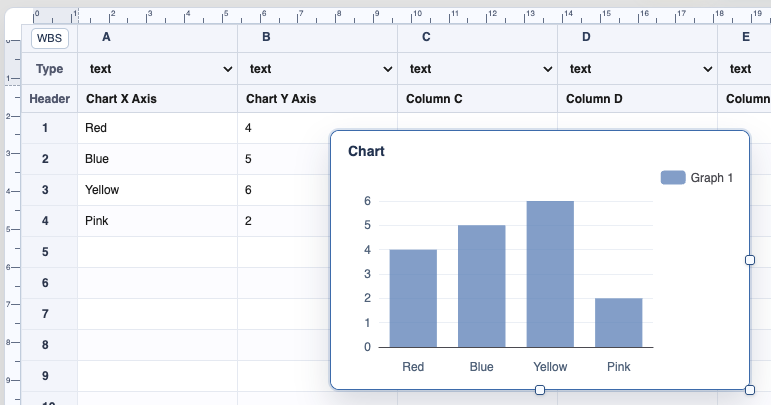
Use the Chart button to insert a chart object, then select it to move or resize it.
Open chart settings
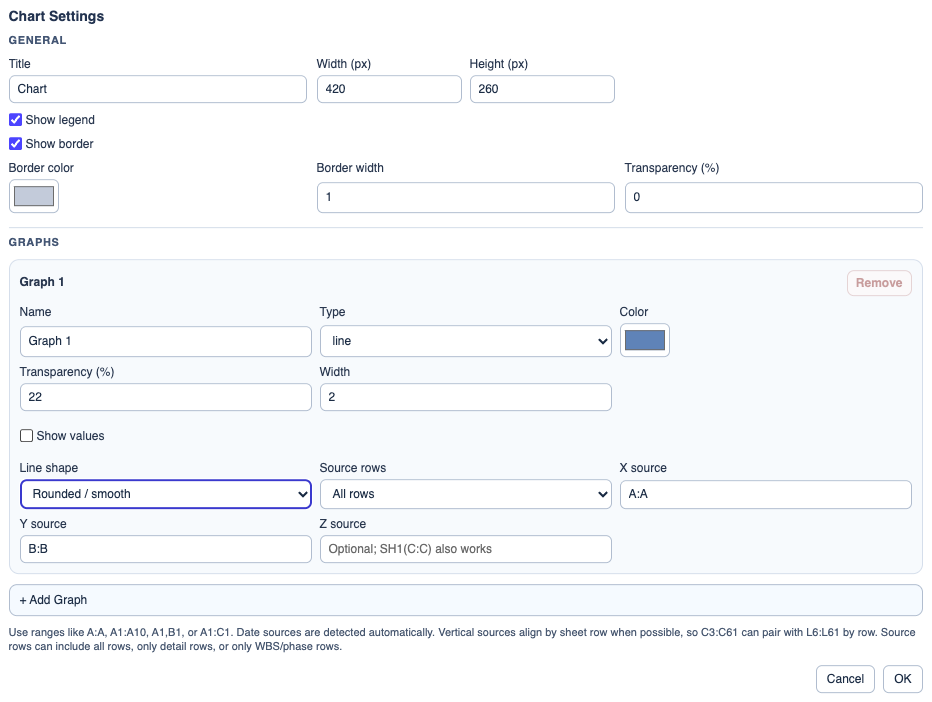
Configure chart title, legend, border, transparency, and the first graph section.
Add another graph if needed
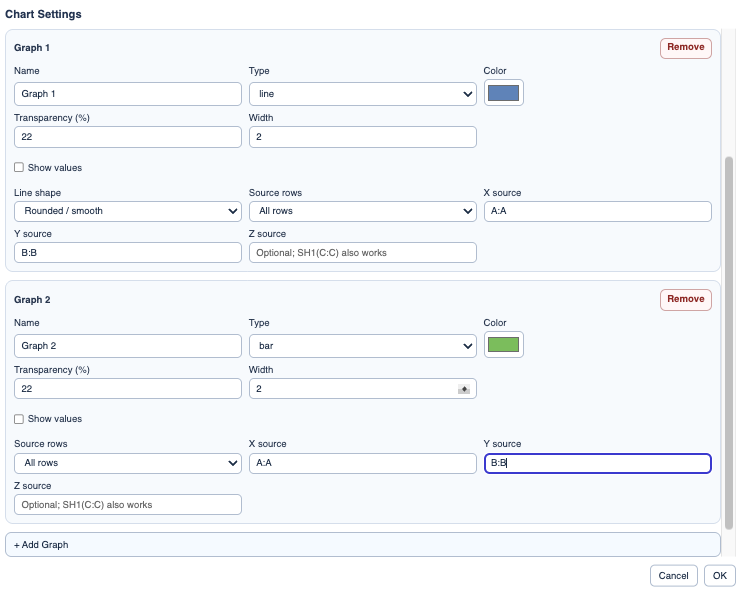
Use another graph section when two ranges should be drawn on the same chart.
Review the result
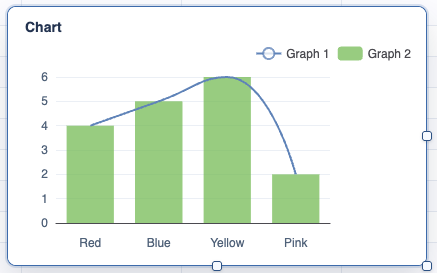
Check the chart in the sheet. If the X values are dates, TableStudio formats them as dates on the axis.
Enable JavaScript to use reading progress and usefulness ratings.