
Create a Geotechnical Cross-Section
Map borehole layer columns, preserve layer colors, and draw a cross-section by layer code.
Use this walkthrough when a sheet contains borehole and layer data.
Related: Geotechnical Charts in TableStudio, Column Type: Lookup.
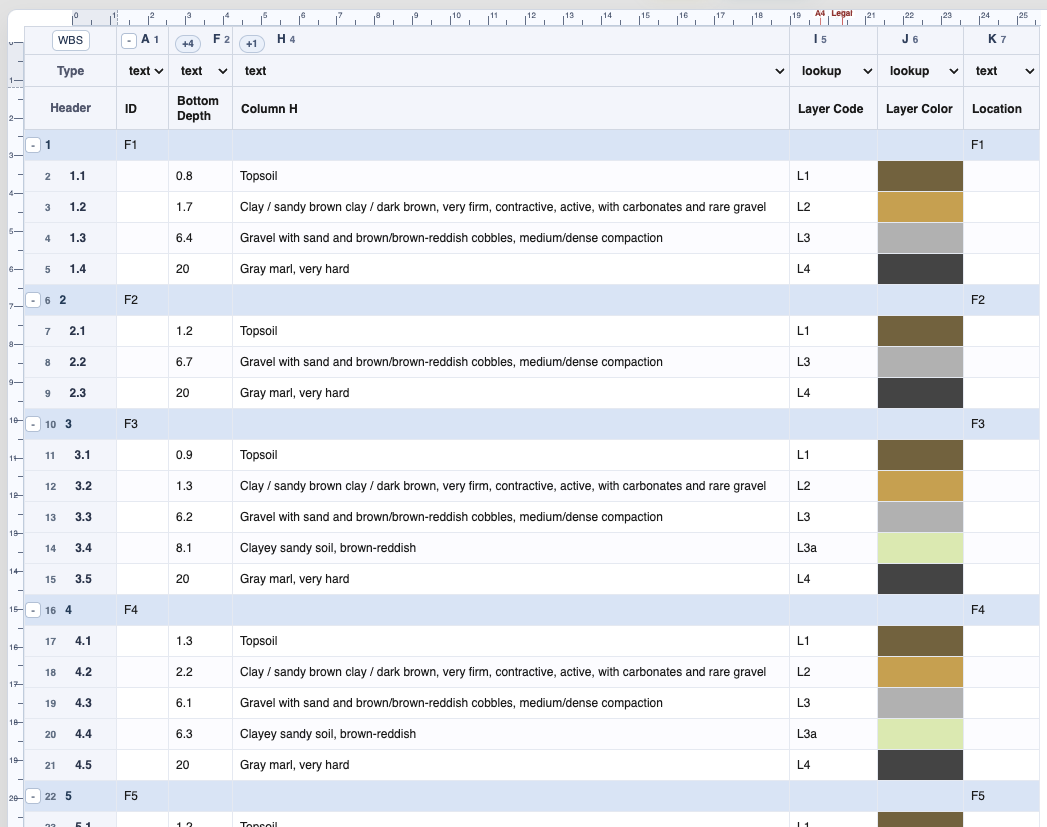
Prepare the source table
Keep borehole ID, section/order, location or X/Y/Z, layer top, layer bottom, layer name, layer code, and optional color in clear columns.
Open geotechnical settings
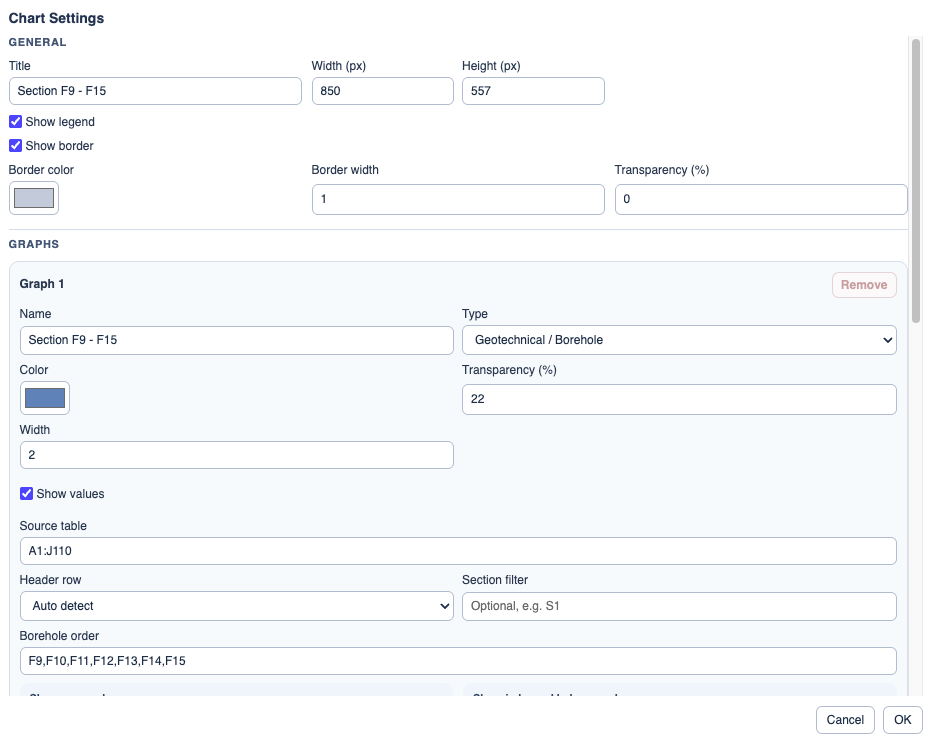
Choose the geotechnical chart type and map the source columns. Missing optional fields can be left empty.
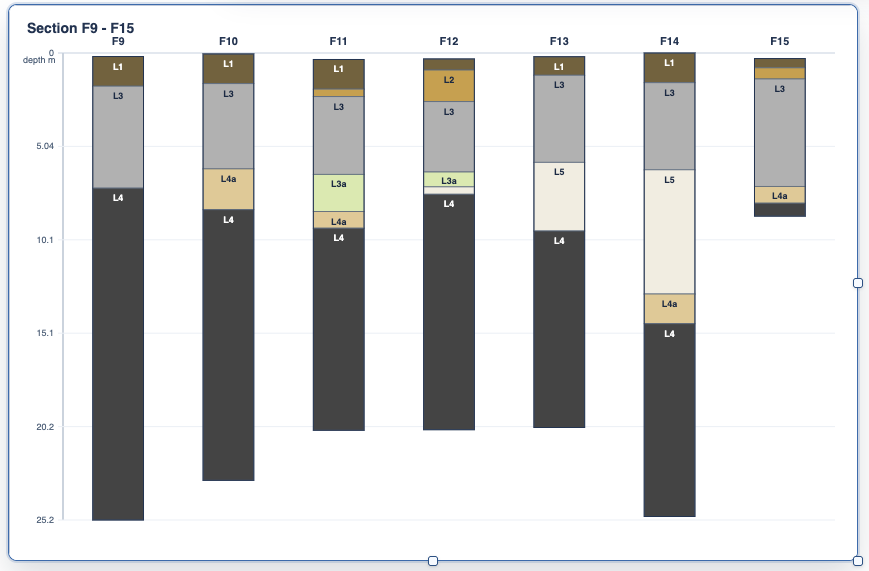
Check borehole view
Use borehole view to verify each drill and layer stack before connecting a section.
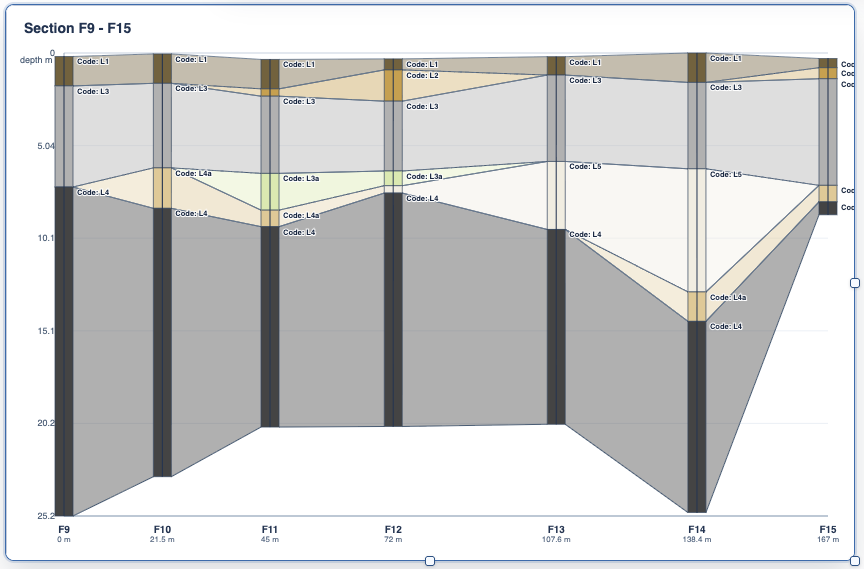
Review the cross-section
Cross-sections connect layers by layer code and follow the selected borehole order.
Enable JavaScript to use reading progress and usefulness ratings.